Run Explorer
Run Explorer app helps you manage all your deployed Pipelines with their different versions and all their respective runs on the execution environment called Engine.
- Every deployed Pipeline (when you run the Pipeline is automatically deployed) is versioned and listed here
- The runs view provides details of all the runs submitted to engine with meta details like run status, created by, created on, run ETA, etc.
Running a Pipeline
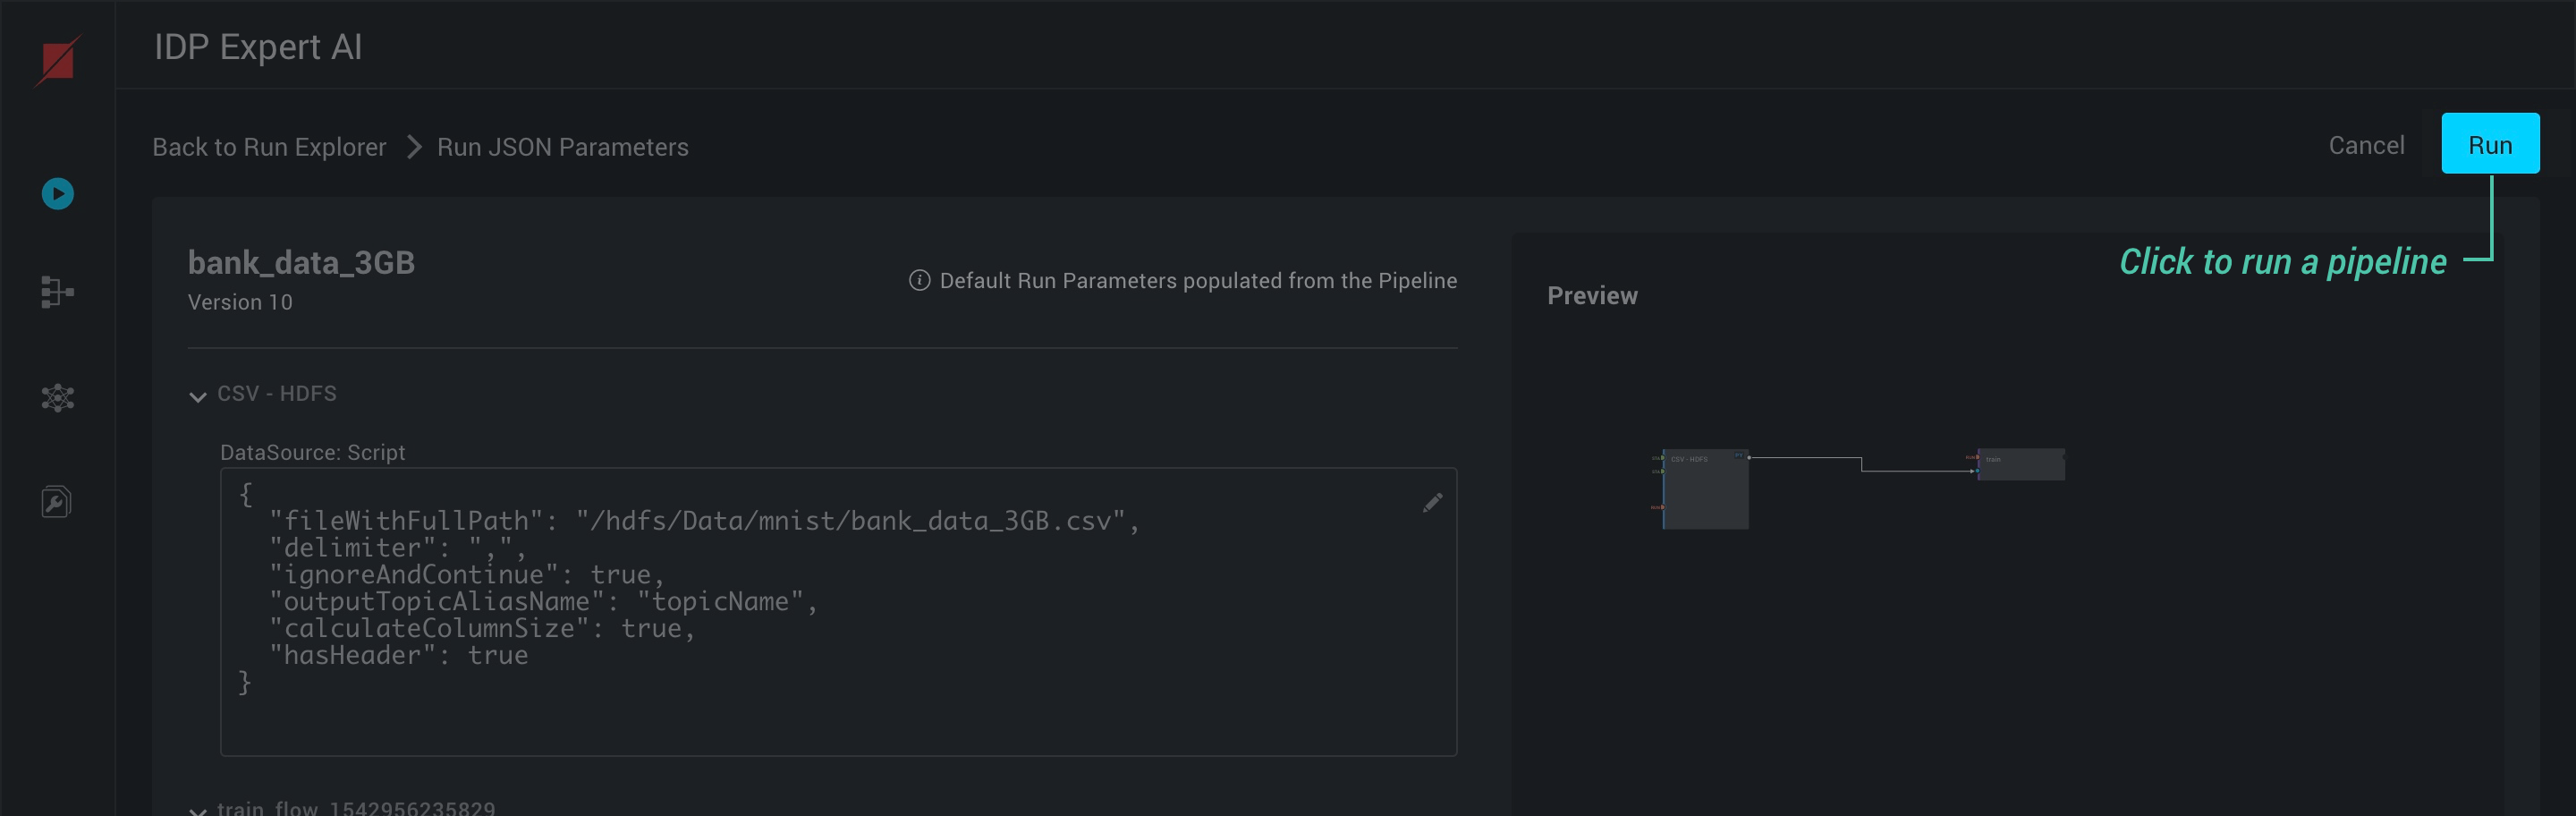 Clicking on the run button in the run versions of the pipeline, you need to configure the run parameters for the pipeline. Also, you can configure the pipeline to run in live mode and you can schedule the pipeline run.
Running Pipeline in Live Mode
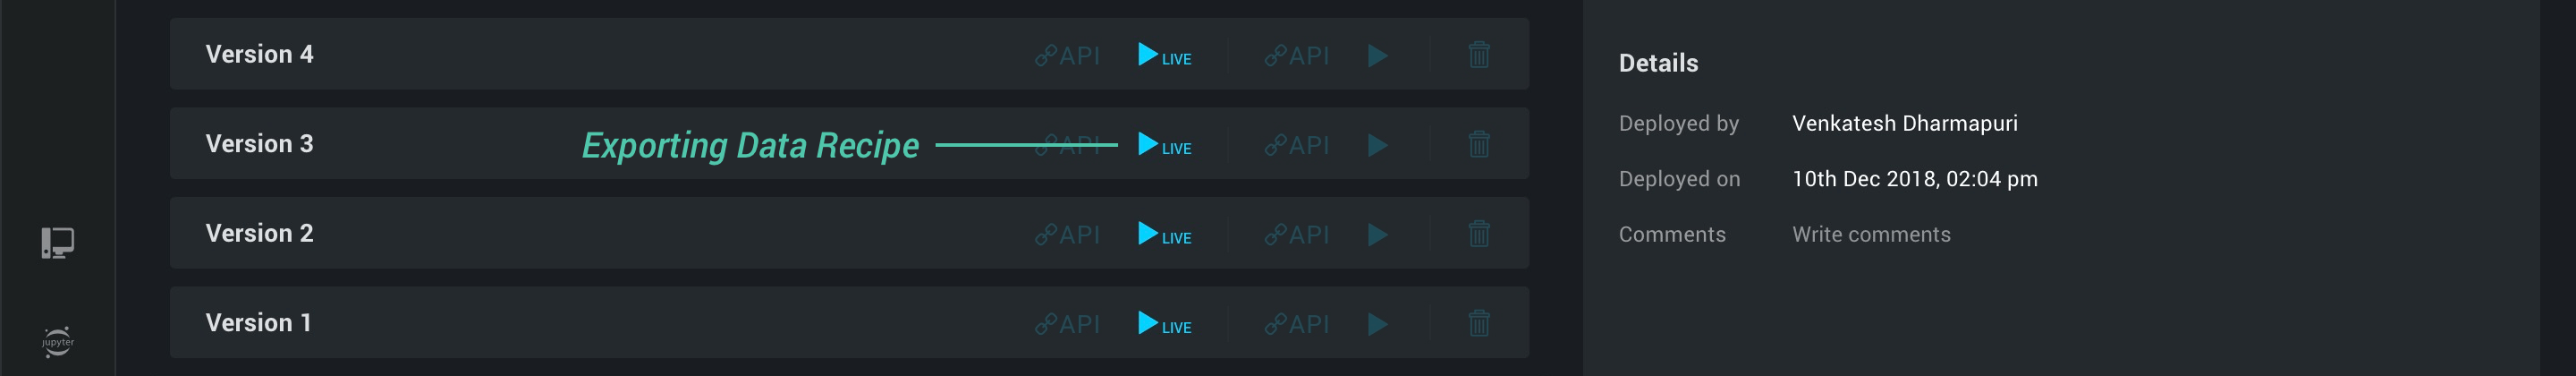 A pipeline can be run in the live mode by triggering the Run with a set of parameters. Once the Pipeline is in live mode, you need to provide only the non-init part of the run parameters. A live pipeline keeps all the blocks running the machines and keeping the memory alive. In the Runs listview, you see a single run for the live Pipeline. Clicking ‘Stop’ will terminate the Pipeline.
View Pipeline API details
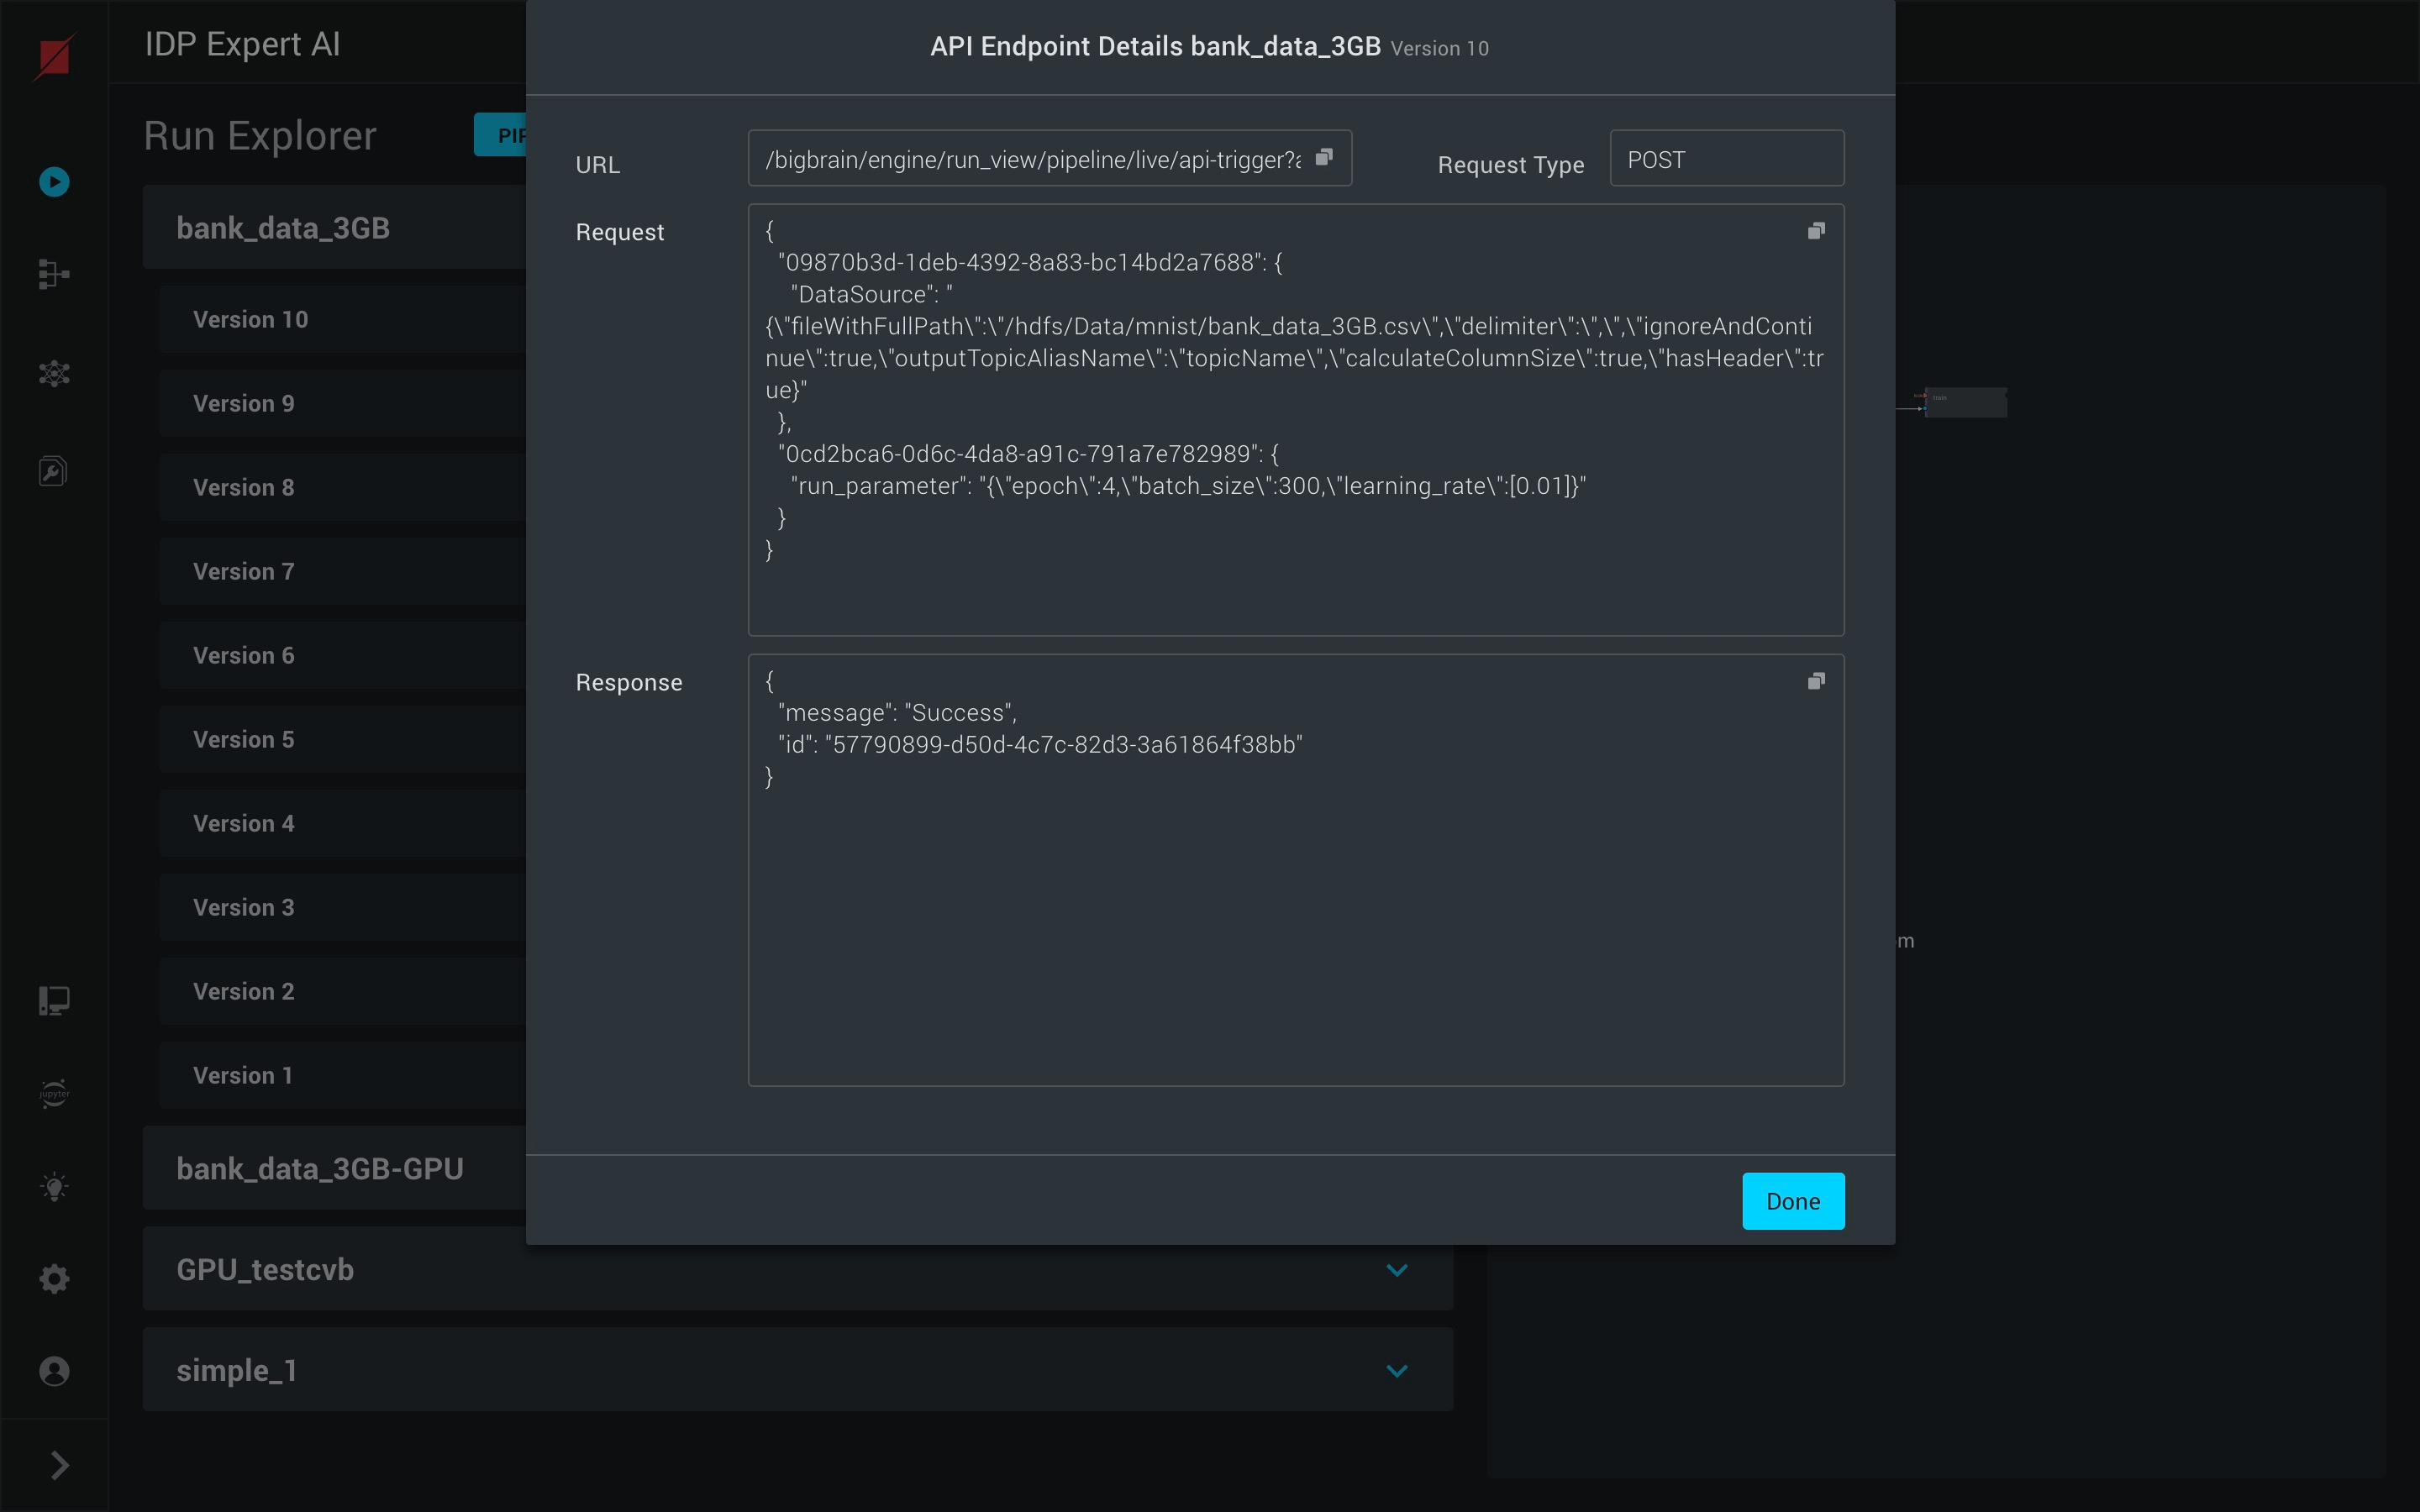 You can view the details of the API for the pipeline for the run by clicking on the API button in the pipeline versions view. A different API is available for Live Pipelines too.
Delete a Pipeline version
You can delete a Pipeline version by clicking on the delete button in the pipeline versions view in the run explorer. This will delete only that particular deployed version.
View list of Pipeline Runs
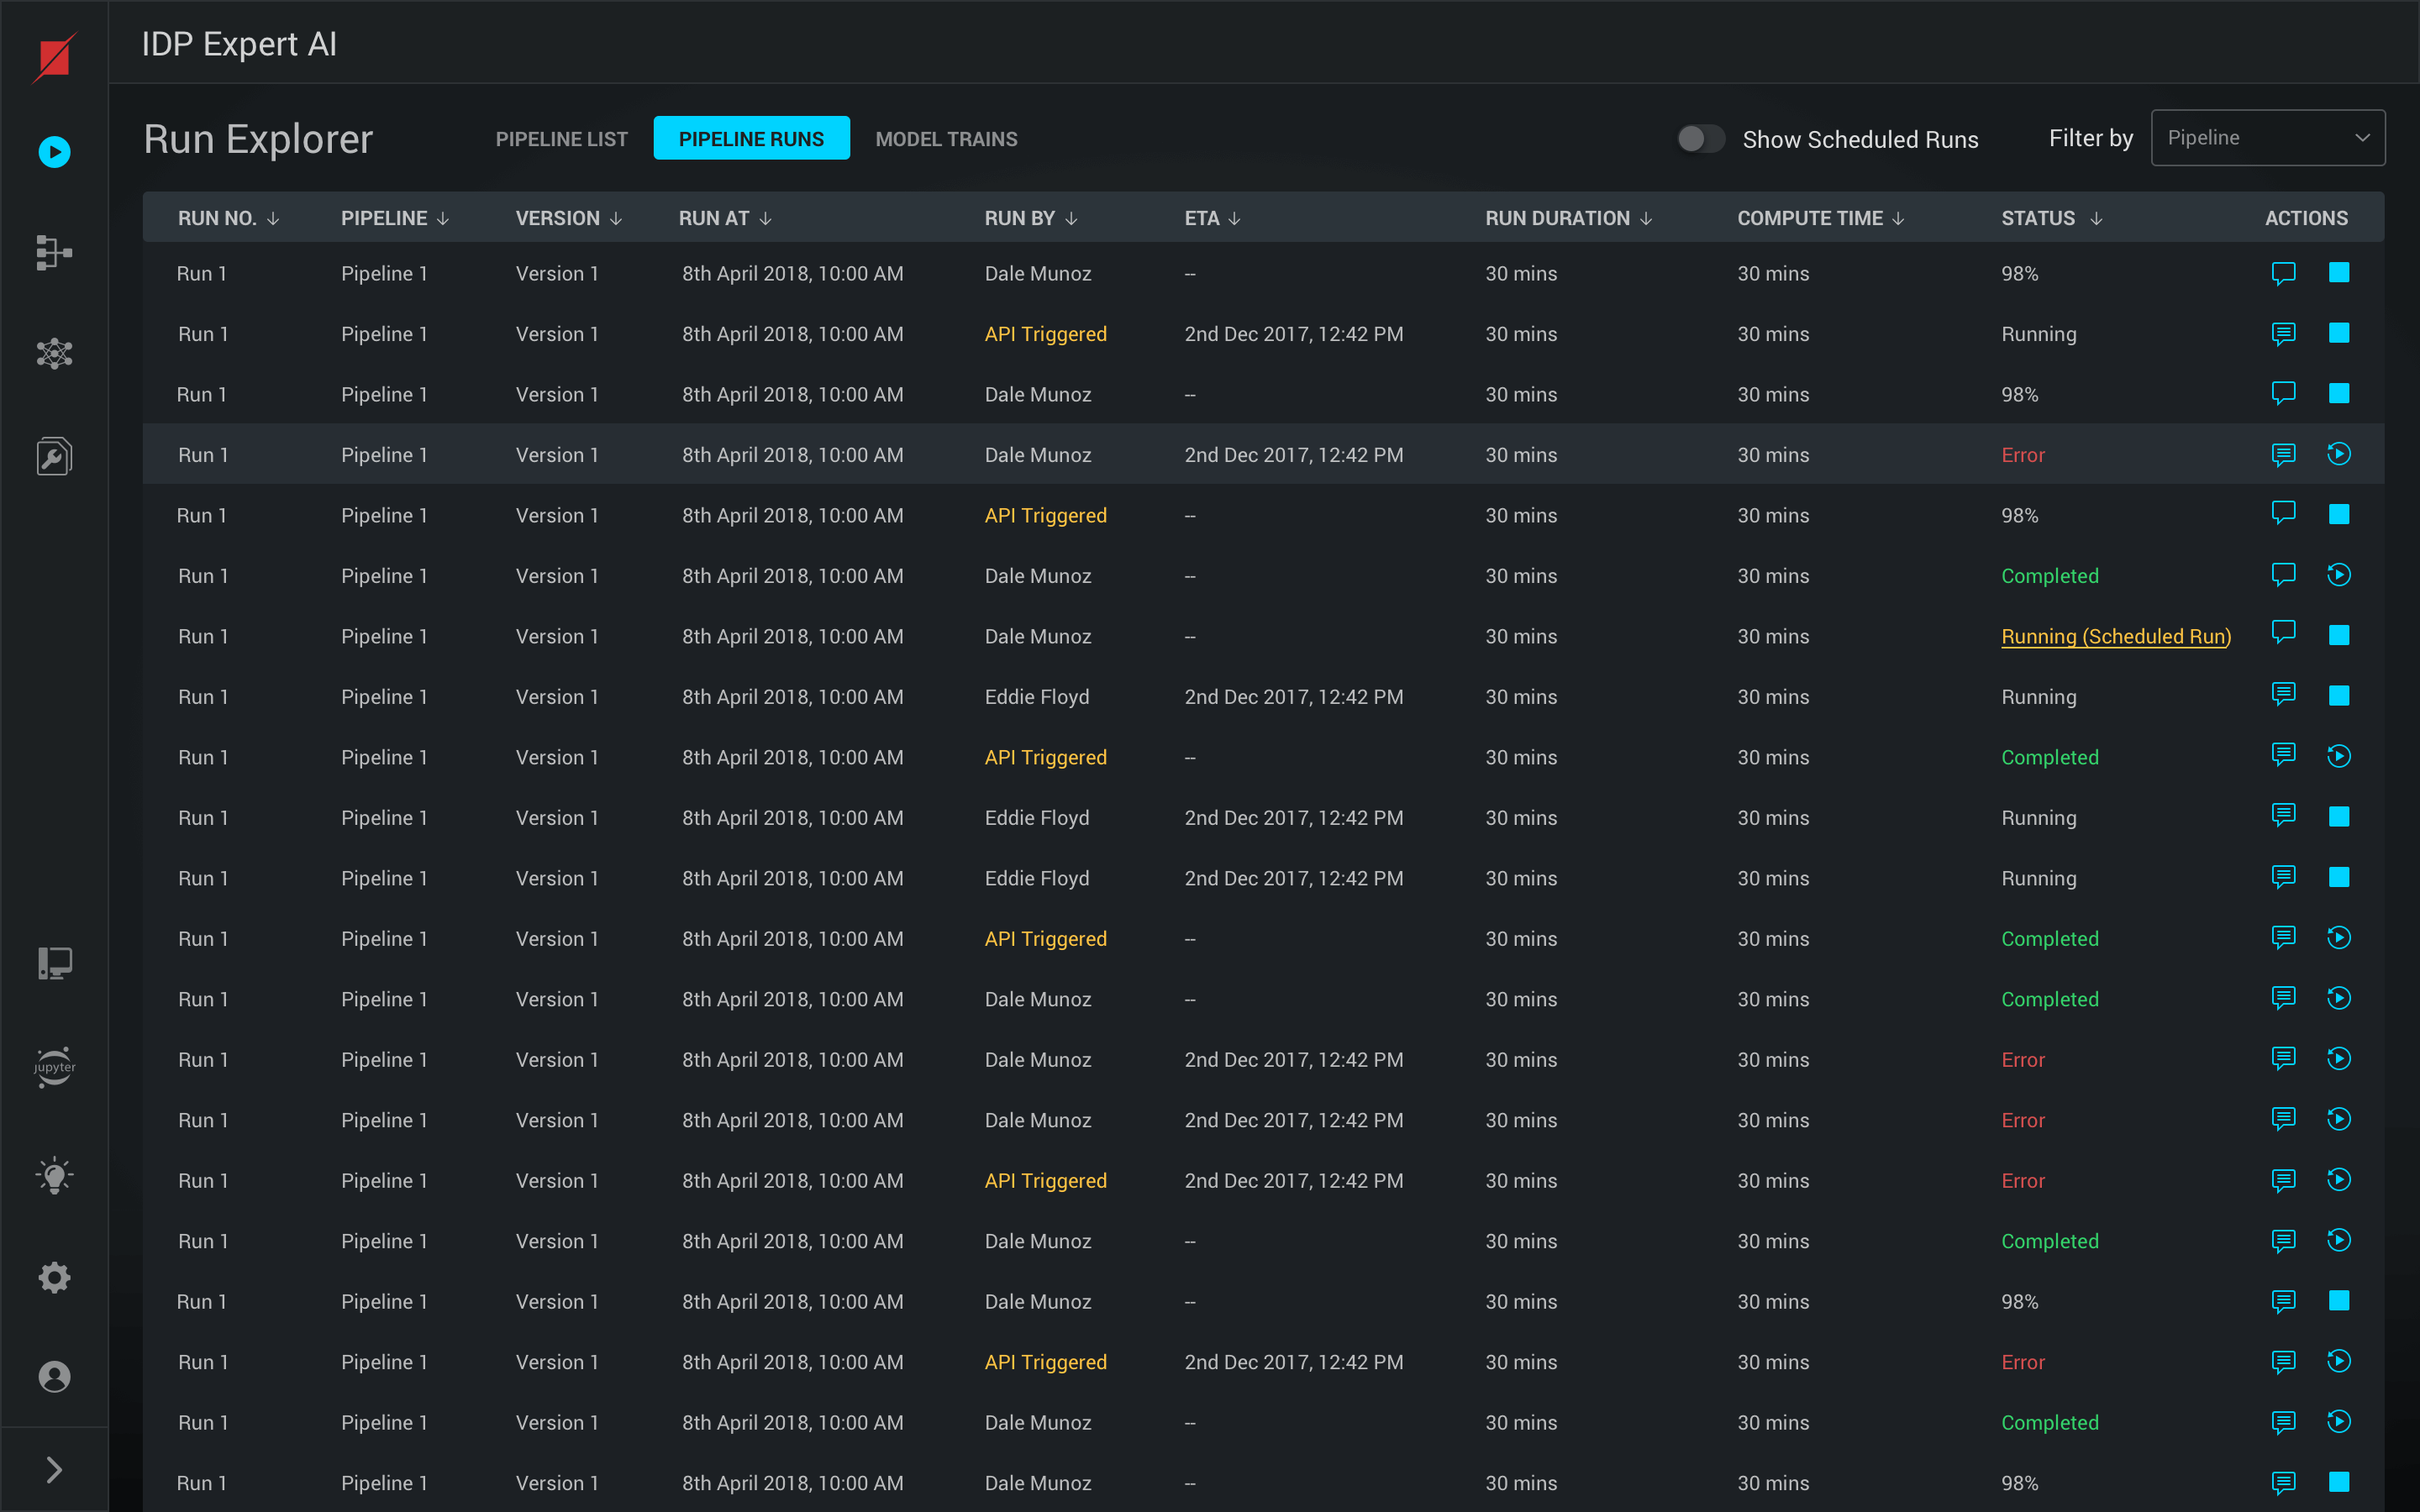 In the pipeline runs view you can see all the runs with details like run number, Pipeline name, version, run at, run by, ETA, run duration, status and some actions (start, pause, and stop).
View live results of a Pipeline Run
When a pipeline run is initiated, you can view the live results of the pipeline run by clicking a particular run. The results interface shows logs, metrics and hardware profile. For example, metrics for a DL Model includes the following graphs and information - model scores, GINI vs epoch, Accuracy vs epoch, cost vs epoch, Confusion matrix, and K-S chart.